
Time-series Analysis for Agribusiness
Time Series Analysis for Agribusiness is an important aspect. Statistics is the branch of mathematics that deals with the gathering, organizing, analyzing, interpreting, and presenting of statistics [1]. It is customary to start with a statistical population or model to be analyzed when applying statistics to a technological, industrial, or social problem. Statistics is the analysis and development of basic techniques for testing theories in light of scientific proof. Statistics is a statistical and theoretical science that examines how evidence and theories connect. The details in statistical analysis are recordings of findings or events, such as a series of measurements of individuals from a population. Populations may involve a wide variety of people or artefact’s, such as “all people living in a region” or “every atom in a crystal.” Statistics is concerned with all facets of statistics, including data collection preparation in terms of a survey and experiment design [2].
Statistics is a field of science that develops techniques to help us make sense of numbers. When applied correctly, statistical techniques have a range of effective instruments for obtaining insight into the world around us. The widespread use of statistical analyses in a variety of fields, including business, medicine, agriculture, social sciences, natural sciences, and engineering, has led to a growing recognition that statistical literacy, or familiarity with the goals and methods of statistics, should be a fundamental component of any well-rounded educational program. In the face of complexity and variation, statistics allows one to make intelligent choices and educated decisions [3].
Time series
A time series is a set of data points that have been indexed (or mentioned or graphed) in chronological order. A time series is a set of information derived at evenly spaced intervals over a period of time [4].
For example:
- In economics, time-series emerge, such as share prices on consecutive days, real incomes in successive months, business revenues in successive years, and so on.
- In the physical sciences, there are several different forms of time series, particularly in methodology, marine science, and geophysics. Rainfall over a period of days, air temperature over a period of hours or months, and so on are examples.
Time series Pattern
Trend
When data indicates a long-term rise or decline, it is considered a pattern. It isn’t necessary for it to be in a straight line. When a pattern shifts from increasing to declining, it refers to as “changing course.”
Seasonal
When seasonal influences such as the time of year or the day of the week influence a time sequence, it is considered a seasonal pattern. Seasonality has a predictable and fixed frequency.
Cyclic
When data shows increases and falls that are not of a fixed frequency, it is called a loop. Economic dynamics are generally to blame for these variations, which are also linked to the “business cycle.” Usually, these variations last at least two years.
Many people mix up cyclic and seasonal behavior, but the two are entirely different. The fluctuations are cyclic if they do not have a fixed frequency; the trend is seasonal if the frequency is stable and related to some part of the year. The average length of a cycle is greater than the average length of a seasonal pattern, and cycle magnitudes are more complex than seasonal pattern magnitudes [5].
Random or irregular
Aside from regular variations, almost all series contain a random or irregular, or residual variation that is not accounted for by secular trend, seasonal, or cyclic variations. These variations occurred as a result of a variety of uncertain and unusual circumstances. It is purely unpredictable and beyond the reach of the human hand but a part of the mechanism. These are exacerbated by earthquakes, conflicts, flooding, famines, revolutions, epidemics, etc.
The Usefulness of Time Series Analysis
Time Series Analysis describes it as “a standardized sequence of values of a variable at uniformly spaced time intervals.” It’s used to figure out what’s driving the data and how it’s structured, pick a forecasting model, and make better decisions.
Time Series Analysis is used for a number of applications, including:
- Analysis of the Stock Market
- Forecasting the Economy
- Studies in inventories
- Analysis of the Budget Analysis of the Census
- Projection of Yield
- Forecasting Sales
and a lot more[6].
Time Series Data
A list of quantities assembled over even time intervals and arranged chronologically is referred to as time-series data. The time series frequency corresponds to the frequency at which data is obtained over a given period of time.
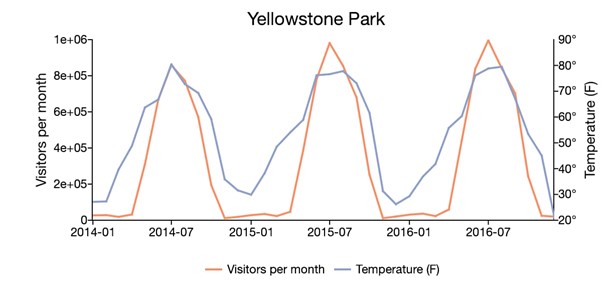
The time-series graph above, for example, shows the number of visitors to Yellowstone National Park each month vs. average monthly temperatures. The data is compiled on a monthly basis and covers the period from January 2014 to December 2016.
Time Series Data Visualization
Time series graph
On the y-axis, observed values are plotted against a time increment on the x-axis in a time-series graph. These graphs can be used to visually highlight the data’s behavior and patterns, laying the groundwork for developing a reliable model.
Visualizing time series data, in particular, offers a preliminary method for deciding if data:
- Is it mean-reverting or explosive in nature?
- Has a pattern over time;
- Seasonality is evident;
- Demonstrates the existence of structural defects.
Mean reverting data
Mean reverting data returns to a time-invariant mean over time. It’s vital to know whether a model has a non-zero mean because it’s a criterion for selecting the best research and modeling methods. A time-series graph can be used to visually inspect data to see if it is mean-reverting and, if so, what means it is based on. Although visual inspection can never be used in place of mathematical estimation, it will assist you in determining whether or not to have a non-zero mean in the formula.
Time Series Data Modeling
Time series models are used for a number of uses, including forecasting potential results, recognizing historical outcomes, and providing policy decisions. The general aims of time series modeling are close to those of cross-sectional or panel data modeling. Time series modeling methods, on the other hand, must account for time series similarity.
Models in the Time and Frequency Domain
The time-domain approach and the frequency domain approach are two approaches to modeling time-series data that have emerged.
Future values are modeled as a function of previous and current values in the time-domain approach. The time series regression of a time series’ present values on its own past values and the past values of other variables are the foundation of this approach. In time series econometrics, the estimates of these regressions are frequently used for forecasting.
The concept behind frequency domain models is that time series can be expressed as a function of time by using sines and cosines. Fourier representations are the name for these types of representations. To model the behavior of the data, frequency-domain models use regressions on sines and cosines rather than past and present values.
| Time Domain | Frequency Domain |
| Autoregressive Moving Average Models (ARMA) | Spectral analysis |
| Autoregressive Integrated Moving Average (ARIMA) Models | Band Spectrum Regression |
| Vector Autoregressive Models (VAR) | Fourier transform methods |
| Generalized autoregressive conditional heteroscedasticity (GARCH) | Spectral factorization |
Time Series Models: Univariate vs. Multivariate
Multivariate time series models and Univariate time series models are two types of time series models. Where the dependent variable is a single time series, Univariate time series models are used. A Univariate time series model is one that tries to model an individual’s heart rate per minute using only historical heart rate measurements and exogenous variables.
When there are several dependent variables, multivariate time series models are used. Each series will be dependent on the past and present values of the other series in addition to their own past values. A multivariate time series model is one that models the US gross domestic product, inflation, and unemployment as endogenous variables[7].
|
Univariate Model |
Multivariate Model |
| Univariate Generalized autoregressive conditional heteroscedasticity (GARCH) | Vector Autoregressive Models (VAR) |
| Seasonal Autoregressive Integrated Moving Average (SARIMA) Models | Vector Error Correction Model (VECM) |
| Univariate unit root tests | Multivariate unit root tests |
Time Series for Agribusiness
One of the most common data forms found in everyday life is time series analysis. The majority of agribusinesses use time series forecasting to aid in the development of market strategies. Certain ‘cause and effect’ behaviors have been monitored, clarified, and predicted using these approaches. Time Series Analysis is used to identify a good basis for predicting industry indicators like stock exchange price, revenue, and turnover, among others. It enables management to recognize and interpret changes in market metrics by analyzing data patterns in real-time. The forecaster hopes to get a greater than average vision of the future by monitoring historical results. Because of its low cost, Time Series Analysis is a common market forecasting tool.
Time Series Methods for effective Agribusiness Development
Regression in Time Series
Autoregressive dynamic time series regression is a mathematical tool for forecasting potential responses based on past response history. Predictors may use time series regression to better explain and forecast the behavior of complex systems based on data observations or experimental data. Time series data is often used in biological, financial, and economic agribusiness systems for modeling and forecasting.
Regression analysis achieves three goals: prediction, simulation, and characterization. The order in which these three goals are achieved is logically determined by the primary goal. Modeling is often used to enhance prediction, and other times it is used to clearly grasp and describe what is happening. The iterative method is often used in prediction and simulation. Predictors can prefer to model in order to obtain predictions in order to gain better control. Iteration and other specialized methods, on the other hand, maybe used to manage challenges in industries.
Planning, production, and maintenance are the three parts of the operation.
Planning:
- Define the problem, choose a solution, and then propose variables.
- The presence of errors in the independent data collection is a condition of standard regression analysis.
- Check to see if the issue is solvable.
- The correlation matrix, the first regression runs, the simple numbers, and the correlation matrix can all be found.
- Make a calendar, set a target, and plan a budget.
- Confirm the priorities and budget with the company.
Development:
- Collect the date and inspect it for quality. Plot and test certain regression models and conditions.
- Experts should be consulted.
- Find the most suitable ones.
Maintenance:
- Test to see if the settings are stable.
- Check the equations, see if any factors are incomplete, and see if the equation can be used to make predictions.
- Statistical methods can be used to verify the model on a daily basis.
Python for Time Series Analysis
Python has a set of time, date, delta, and timespans representations. It’s useful to learn how Pandas communicates with other Python packages. Pandas is a Python software library that was created specifically for the finance industry, so it provides some basic financial data resources to ensure agribusiness growth.
Understanding Date and Time Data
- Time Stamps: A timestamp is a guide to a certain period in time.
- Time cycles and periods: This term refers to the amount of time that passes between one moment and another.
- Time deltas, also known as durations, refer to a fixed amount of time.
Dates and times in native Python
The built-in module contains Python’s simple artefacts for dealing with dates and times. Scientists may use these modules in conjunction with a third-party module to execute a variety of useful functions on dates and times in a short amount of time. You may also use the module to parse dates from a number of different string formats.
Working with Time Series Data with Pandas Data Structures:
The timestamp and datatimeIndex objects are the most basic of these objects.
- Time Stamps type: It is based on NumPy, which is more effective.
- Time Periods is a Numpy-based category that encodes a fixed-frequency interval.
- The sort of time deltas is NumPy-based.
- The related index structure is TimedeltaIndex.
In Relation to R, Time Series
R is a widely-used programming language and open software environment for data mining by statisticians and data miners. It consists of a series of libraries created exclusively for data science.
R has one of the most diverse environments for data collection. It’s easy to find a library for any needed research thanks to the open-source repository’s 12,000 bundles. R’s rich library makes it the best option for statistical research, particularly for advanced analytical work, according to agribusiness managers. R has excellent functionality for communicating results to the team, such as reporting and recording resources, which make it much easier to understand the study. Time series models such as the random walk, white noise, autoregression, and plain moving average have qualities and formal equations. Simulating, modeling, and predicting time series patterns are only a few of the R functions for time series results.
R was created by academics and scientists and is intended to solve statistical problems. It has the capability of doing time series analysis. It is the most effective method for forecasting agroindustry.
Analyzing Time Series Data
Data is collected at various points of time for time series data processing. This differs from cross-sectional data, which looks at firms at a particular point in time. In Time Series Data Analysis, there could be a link between measurements since data points are collected at neighboring time intervals.
Data on time series can be found in:
- GDP, CPI, unemployment rates, and other economic statistics.
- Population, birth rates, migration data, and political indicators are all examples of social sciences.
- Mosquito population, disease rates, and death rates are all researched in epidemiology.
- Weight monitoring, cholesterol measurements, heart rate monitoring, and blood pressure control are all examples in medicine.
- Monthly sunspot measurements, world temperatures, and emission levels are also examples of physical sciences.
Seasonality
One of the most important features of time series data is seasonality. When the time series shows predictable and frequent cycles at time intervals less than a year, it is said to be cyclical. Retail revenues, which grow from September to December and fall from January to February, are the best example of a time series data of seasonality.
Breaks in the structure
Time-series data also reveals a sharp difference in behavior at a certain point in time. Structural splits are the term for such unexpected shifts. They can induce uncertainty in a model’s parameters, reducing the model’s reliability and validity. Time series plots can aid in the detection of data structure breaks.
Time Sequence Deep Learning
Working with long sequences, multi-step forecasts, noisy data, and various inputs and output variables makes time series forecasting extremely difficult.
Time-series forecasting features such as temporal dependency, automated learning, and automatic management of temporal systems like seasonality and patterns are all available with deep learning approaches.
The Advantages of Using Deep Learning for Time Series Analysis
Features that are easy to extract:
Deep neural networks reduce the need for data scaling procedures and stationary data and function engineering methods, which are also important in time series forecasting. Deep learning neural networks can learn on their own. They will remove features from the raw input data on their own after training.
Pattern-recognition skills:
In Recurrent Neural Networks, each neuron has the ability to retain information from previous inputs in its internal memory. As a result, it is the best option for Time Series data that is sequential.
From training results, it’s simple to predict:
Long short-term memory (LSTM) is a common time series model that is easy to predict from training data. Deep learning models such as the gradient boosting regressor, random forest, and time-delay neural networks can easily represent data at various points in time.
Agribusiness Development Benefits from Time Series
Since it is focused on historical data trends, time series forecasting assists companies in making better agribusiness decisions. It can be used to predict future incidents and circumstances.
Reliability:
Time series forecasting is the most accurate, particularly where the data spans a long period of time, such as large numbers of observations over longer periods of time. Data can be measured at different intervals to retrieve information.
Seasonal trends:
The variances in data points will show seasonal fluctuation patterns that can be used to produce predictions. Such data is especially useful for markets with seasonal goods because it allows them to prepare for production and distribution requirements.
Estimating patterns:
Administrators should use the time series approach to detect trends and data tendencies from it can be helpful when measurements indicate a decline or rise in revenue for a single product.
Development:
The time-series approach can be used to monitor both endogenous and exogenous growth. Endogenous development happens as an organization’s existing human capital grows in a manner that contributes to economic growth. Time series analysis, for example, may be used to demonstrate the effect of policy factors [8].
Conclusion
Time series analysis is used to learn about the underlying structure and role of the measurements. Understanding the mechanisms of a time series allows for the creation of a model that describes the data in a manner that allows for estimation, analysis, and regulation. Time series analysis is useful for determining how an asset, security, or economic variable changes over time. It may also be used to equate the changes associated with a certain data point to changes in other variables over the same time frame. So, The importance of time series analysis for agribusiness cannot be denied.
Reference
- Dodge, Y., & Commenges, D. (Eds.). (2006). The Oxford dictionary of statistical terms. Oxford University Press on Demand.
- Romeijn, J. W. (2014). Philosophy of statistics
- Peck, R., Olsen, C., & Devore, J. L. (2015). Introduction to statistics and data analysis. Cengage Learning.
- Retrieved fromhttps://www.abs.gov.au/websitedbs/d3310114.nsf/home/time+series+analysis:+the+basics
- Retrieved from https://otexts.com/fpp2/tspatterns.html
- Retrieved from https://www.researchoptimus.com/article/what-is-time-series-analysis.php
- Retrieved from https://www.aptech.com/blog/introduction-to-the-fundamentals-of-time-series-data-and-analysis
- Retrieved from https://www.fingent.com/blog/5-time-series-analysis-methods-for-better-business-decision-making/
Written by Mahamudul Hasan Millat
Research Scholar
Statistics Discipline
Science, Engineering & Technology School
Secretary, Rotaract Club of Khulna University
Khulna University, Khulna-9208, Bangladesh
Email: millatku1998@gmail.com