Inflation and its type, causes, and impact on the economy
Inflation is the result of too much money being spent to buy too few products. An increase in average prices that is maintained is referred to as inflation. Here, the emphasis is on the term “sustained”. Price growth over an extended period of time is what is meant by inflation, not a spike in prices over a brief period of time.
One of the most fundamental economics principles is the notion that inflation rises when the money supply increases.
Inflation: the Silent Tax, the Loud Grinder
“Inflation is as violent as a mugger, as frightening as an armed robber and as deadly as a hit man” – Ronald Reagan
Is there any human in this world who has never dreamt of having a machine that prints money? Printing notes, whenever it is needed, must be the most common mind’s eye. Ironically, what our imagination does not take into account is the fact that money is mainly used as a medium of exchange and, consequently, the more money there is in an economy, the more goods and services will cost. Inflation and its type, causes, and impact on the economy are very crucial for any kind of business.
Its roots can be seen in the works of Salamanca School philosophers Martn de Azpilcueta and Tomás de Mercado, as well as Jean Bodin and David Hume, who were worried about the effects of a glut of precious metals coming from Spain’s American possessions. Irving Fisher, one of the greatest economists of the 20th century, codified this idea by giving it a framework for analysis that quickly gained acceptance. Milton Friedman, the recipient of the Nobel Prize in Economics, is famous for saying that
“Inflation is always and everywhere a monetary phenomenon in the sense that it is and can be produced only by a more rapid increase in the quantity of money than in output”.
Economists still firmly believe this statement to be true. Keynesian economists and monetarists, the two major schools of economic thought from the 1940s through the 1970s, disagreed on how the money supply and inflation are related. Fisher’s formalization, which is just a straightforward mathematical identity, was accepted by both sides. It states that a country’s economy can only be said to be in equilibrium when its money supply equals the total value of transactions. Monetarists concentrate on the long term, when prices lose their rigidity and react to the money supply, whereas Keynesians think of the near term when prices stay relatively rigid.
Because of this distinction in focus, monetarists supported the notion that inflation is primarily a monetary event (i.e. generated by changes in the money supply), while Keynesians contended that it is largely driven by real variables (such as the unemployment rate).
Different economists have categorized inflation in different ways.
Deflation and disinflation are terms that are frequently mixed up. Disinflation, also known as a slowdown in the rate of increase of the general price level of goods and services in a country’s gross domestic product over time, is the opposite of inflation and is defined as a decrease in the rate of inflation. It is the antithesis of reflation, which is a fiscal or monetary strategy aimed at increasing output, boosting expenditure, and reducing the impacts of deflation, which typically happens during a period of economic instability or a recession. High inflation and high unemployment are referred to as stagflation. On the other hand, hyperinflation is a time when the level of prices as a whole increases very quickly.
A slow, steady, and predicted inflation or deflation is not a concern, but a sudden spike in both causes significant issues and costs. Unexpected increases or decreases in prices:
- Reduces real GDP and employment,
- redistributes wealth, and
- Diverts resources from the productive process.
Measuring Inflation
There are two techniques to gauge the price level of an economy.
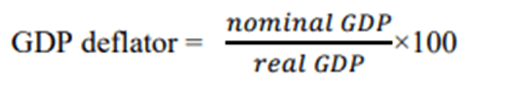
A widely used indicator of price level, the GDP deflator is derived as the nominal GDP to real GDP ratio multiplied by 100.
It compares the level of prices right now to the level from the base year. The GDP deflator is used to calculate the country’s inflation rate over two consecutive years.
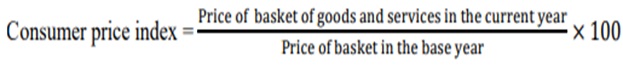
Customer Price Index
The CPI measures the total cost of the goods and services that a typical consumer purchases.
Inflation is a financial phenomenon, as it is over the long term. If the money supply increases more quickly than the potential GDP, it happens. Real GDP and price level interact, but a number of reasons can trigger inflation in the short term. We make a distinction between two sources of inflation to better understand these interactions:
Inflation is a financial phenomenon, as it is over the long term. If the money supply increases more quickly than the potential GDP, it happens. Real GDP and price level interact, but a number of reasons can trigger inflation in the short term. We make a distinction between two sources of inflation to better understand these interactions:
Demand-Pull Inflation
Demand-pull inflation is the term used to describe inflation that originates as a result of rising overall demand. Any of the elements that alter aggregate demand can start demand-pull inflation. Examples include lowering the interest rate, increasing the money supply, increasing government spending, cutting taxes, increasing exports, or increasing investment that is encouraged by rising predicted future profits.
For two different sorts of goods, demand-pull inflation can be considered:
- Perishable goods
The completely elastic curve known as QS represents the supply of products. The reason for this is that throughout the market time, the supply of commodities is fixed. The factor that significantly influences the price level is the demand factor. Demand curve dd is what it is in the beginning, and point an is where equilibrium and price are. Since points b and c represent the equilibrium, the price climbs from OP to OP1 and OP2 when the demand grows from dd to d1d1 and then further to d2d2. As a result, prices are rising as a result of demand forces.
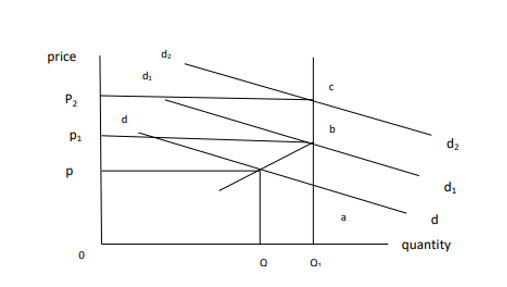
- Non-perishable goods
The SS curve is a supply curve that initially exhibits price elasticity up to a certain point where shocks are greater, after which it completely loses this property due to the lack of further stock. The initial demand curve (dd) and equilibrium point (a) determine the price (OP) and quantity (OQ) respectively. As the demand rises from dd to d1d1, point b, the equilibrium, which results in OP1 pieces and OQ1 quantity, is reached.
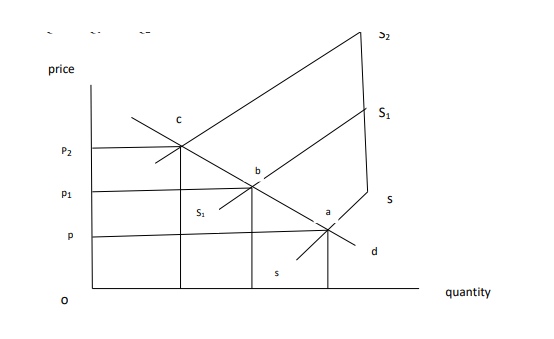
If demand rises to d2d2, the price will rise to OP2, but only OQ1 will be delivered. Price increases are driven by demand.
■ Cost-push inflation
Cost-push inflation is defined as inflation that is driven by an increase in costs. The two primary causes of price increases are
- An increase in the money wage rate
- An increase in the money prices of raw materials.
We can picture a scenario where prices could grow even when there is no increase in total demand. If costs continue to rise, especially wage costs, this may occur. The demand for labor is now rising gradually as the level of employment rises, improving the workers’ negotiating position. They may request a pay increase to take advantage of this circumstance even when it is not justifiable due to either a preceding gain in production or the cost of living.
Read more: Importance of Demand Elasticity
Because businesses anticipate passing on these increases in expenses to consumers in the form of higher prices, employees in high demand and employment situations are more willing to acquiesce to these wage claims. If it does, there will be an additional inflationary force at play. The figure’s y-axis represents price, while the x-axis represents quantity required and supplied. A is the equilibrium point, and initially, dd is the demand curve and ss is the supply curve. The price is OP, and the ordered quantity is OQ.
The SS curve swings to the left as production costs rise. Because of this, the new equilibrium point is b, which results in the new price OP1 and quantity OQ1. The new equilibrium point will be reached at c, where the price is OP2 and the quantity is OQ2, as a result of future increases in production costs. From this, it is clear that on the one side, the price goes up from OP to OP1 to OP2, but on the other side, the quantity goes down from OQ to OQ1 to OQ2.
Therefore, cost-push is to blame for the price increase, which also results in fewer products being delivered to the market. All that it is is cost-push inflation.
Expectations and Inflation
Firms’ predictions for future prices may have an impact on the decisions they make now when determining the price and output. In anticipation of a competition price increase, a company may decide to raise its own pricing. Let’s take a look at a company that produces toasters in a market that isn’t entirely competitive. The toaster manufacturer must choose the price it will sell its product for in retail establishments. It will lose plenty of customers if it estimates the price too high and charges much more than other toaster manufacturers do. It will win customers but at a considerable loss in revenue per sale if it undervalues price and charges substantially less than other toaster manufacturers do.
The price at which a company may maximize its profits is likely not too different from the average of prices charged by its rivals. It must base its price on what it anticipates the prices of its rivals to be if, as is frequently the case, it does not already know what those competitors’ anticipated prices will be.
Read more:Price Mechanism Limitations
It is frustrating because expectations may influence the level of the price. The inertia caused by expectations might make it challenging to halt an inflationary cycle. Firms may continue raising prices even if demand is slowing or declining if prices have been growing and people’s expectations are adaptive—that is if they base their expectations on prior pricing behavior.
Money and Inflation
It is clear that a rise in the money supply can result in a rise in the overall price level. The AD curve moves to the right resulting in a higher price level when the money supply (Ms) increases. Simply put, this inflation is driven by demand. We shall refer to this type of inflation as “sustained” inflation and believe that it can also be attributed to the availability of money.
We understand monetary policy to be changes in the money supply (MS), which have an impact on the interest rate (r). A central bank can alter the amount of reserves necessary, the discount rate, and the money supply by adjusting all three of these variables, as well as by conducting open market transactions (buying and selling government securities). Open market operations are the primary method through which the central bank modifies the money supply.
The central bank can increase or decrease the money supply to any level it chooses through these procedures. The monetary policy account needs two crucial additions in order to be plausible.
First, rather than focusing on the money supply, the central bank targets the interest rate in practice. The second argument is that the Central Bank’s choice of interest rate depends on the health of the economy.
Read more: Supply Affecting Variables or Supply Determinants
Targeting the Interest Rate
The diagram below makes it simple to understand how the central bank operates-
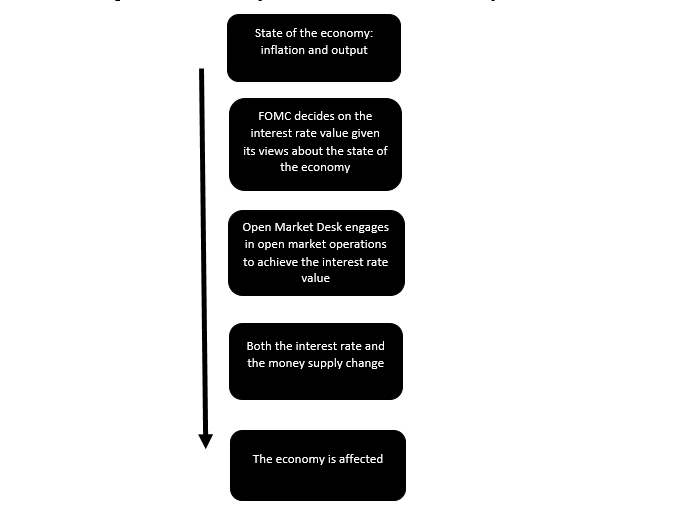
The major objectives of the central bank are high levels of output and employment as well as a low inflation rate. A fully employed economy with an inflation rate close to zero is ideal from its perspective. Stagflation —high unemployment and high inflation—is the worst scenario.
If the economy is producing on the relatively flat region of the aggregate supply curve due to low output or low inflation, the central bank can boost output by cutting interest rates with little impact on the level of prices. The rightward shift in the aggregate demand curve caused by the expansionary monetary policy will result in an increase in output with minimal change in the level of prices.
When output is low and inflation is low, the Central Bank is likely to reduce interest rates (and so expand the money supply). In periods of high output and inflation, the opposite is true. In this scenario, the Central Bank has more control over the interest rate and can reduce the money supply without significantly affecting output. A decrease in price levels and no impact on output are the results of the contractionary monetary policy. During periods of strong output and high inflation, the Fed is likely to raise the interest rate and so reduce the money supply.
Read more: Factors Affecting Supply Elasticity
Inflation targeting is a practice used by some monetary authorities around the world. If a monetary authority acts in this manner, it will first publish a target inflation rate, typically for a time period of one year or more, and then decide on interest rate levels with the intention of containing the actual inflation rate within a given range of the target value.
#inflation #demandaverageinflation #costpushinflation #built-ininflation #importedinflation #aggregatedemand #aggregatedemandcurve #aggregateas #aggregateascurve #pricelevel #purchasingpower #inflationaryspiral #stagflation #deflation #monetarypolicy #fiscalpolicy #economicgrowth #unemployment #incomedistribution #consumerpriceindex #GDPdeflator
Written by Fariha Nur

Economist & Director, Agribusiness Education and Research International (AERI)
Email: farihanur.ru@gmail.com
Contact:
If you have any questions, thoughts, or suggestions, please contact us or join our social media networks.
Email us: agribusinessedu@gmail.com, info@agribusinessedu.com
Feel free to comment:
Your email address will not be shared with anyone.
Join our LinkedIn group
https://www.linkedin.com/groups/13943442/
Join our Facebook group
https://www.facebook.com/groups/agribusinesseducationandresearchinternational
Read More:
Importance of Consumer’s Surplus
Profit Maximization Critique Hypothesis
Fundamental Assumptions of Indifference Curve Analysis
Importance of the law of equi-marginal utility
Producers Surplus of Agricultural Commodities
Classification of Agricultural Markets
Importance of the law of equi-marginal utility
Features of Oligopoly Market with Examples