
Importance of Robust Statistics
Outliers, or variations in the total variation distance, are generally the subject of robust statistics. The deliberate corruption of a dataset, however, can take many different forms, including systematic measurement errors and the absence of confounders. Robust statistics are those that perform well for data derived from a variety of probability distributions, particularly for non-normal distributions.
Sample statistics that approximate the values of their corresponding population variables include the mean, median, standard deviation, and interquartile range. The sample values should ideally be near to the population value and not consistently overly high or low (i.e., unbiased). However, some sample statistics might result in biased, subpar estimates because of outliers and extreme values in the long tail of a skewed distribution. The sample statistics will go further away from the correct value and be systematically too high or too low. In contrast, when there are outliers and extreme values in the long-tails, a robust statistic will be effective, have a negligible bias, and be asymptomatically impartial as sample size increases. Robust statistics won’t systematically overestimate or underestimate the population value even in the presence of outliers and long tails because they will be pretty near to the right value given your sample size. Also, the statistic becomes closer to being completely impartial as the sample size grows. Outliers and long tails have little or no effect on robust statistics. In particular non-normal distributions, they perform well in a wide range of probability distributions.
Example: If we increase one of the data set’s values to a much higher number, let’s say 1000. The median stays at 3.5 but the mean grows significantly. The median is resistant to the extreme observation, to put it another way. This is because the median solely depends on the middle of the distribution, but the mean depends on all observations in the data set.
The Meaning of Robust Statistics
Commonly, the traditional presumptions of normalcy, independence, and linearity are not met. These assumptions lead to skewed results from statistical estimators and tests, depending on the “magnitude” of the departure and the “sensitivity” of the method. A statistical theory that takes into consideration this kind of departure from parametric models is required in order to get accurate results. Many probability distributions are possible with nonparametric statistics. It is no longer necessary to limit yourself to, say, regularly distributed data. Nonparametric statistics, however, also makes several significant presuppositions, such as symmetry and absolute continuity. Again, departing from these requirements produces outcomes that are skewed and distorted. In a parametric model’s “neighborhood,” robust statistics operates. Although it allows for deviations, it makes use of the benefits of parametric models. One way to think of robust statistics is as a theory of approximatively parametric models. According to Hampel et al., the definition of robust statistics is “in a broad informal sense, a body of knowledge, partly formalized into ‘theories of robustness,’ dealing to departures from idealized assumptions in statistics.”
What is the aim of robust statistics?
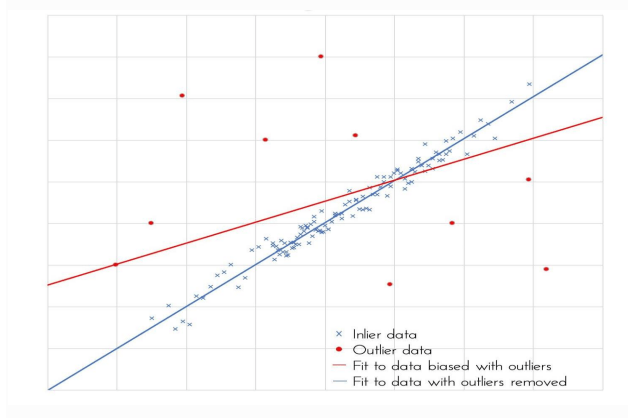
Classical statistical techniques aim to best match all available data points. The most common criterion is least squares, where the parameters must be estimated by minimizing the sum of the squared residuals. The parameter estimates may differ significantly from those produced from the “clean” data if the data set contains outliers. For instance, the regression line may be drawn to outliers. Large deviations are dispersed throughout all the residuals in the least squares criterion, making them frequently difficult to identify because all data points receive the same weight.
Reduced influence of outliers is one goal of robust statistics. Robust approaches aim to fit the majority of the data, presuming that the number of reliable observations outweighs that of the outliers. The residuals, which are significant in the robust analysis, can then be used to detect outliers. Asking what led to these outliers is a crucial task that comes next. They must be examined and interpreted, but they should not be disregarded.
In the event that actual results differ from idealized assumptions, robust statistics should guarantee accurate outcomes. Unexpected serial correlations that result from violations of the independence assumption are another type of deviation in addition to outliers. The removal of a few extreme data points is not sufficient to achieve robust statistics. Effective statistical techniques should also guard against efficiency loss, which reduces the accuracy of the statistical estimation.
What are Robust Statistical Analyses?
Even in cases when real-world data may not meet the ideal circumstances, robust statistical analysis can nonetheless yield reliable conclusions. These methods work well when the sample data contain unusual values and different distributions. In other words, even if the assumptions are not entirely met, you may still trust the results.
For instance, parametric hypothesis tests that evaluate the mean, such t-tests and ANOVA, presumptively presume that the data are distributed normally. Yet when your sample size per group is sufficiently big, the central limit theorem makes these tests resilient to deviations from the normal distribution.
Similar to parametric analyses, which make no assumptions about the distribution of the data, nonparametric analyses evaluate the median. Nonparametric analyses also resist the effects of outliers, much like the median.
Measures of Robustness
In the literature, a number of robustness measures were proposed. The breakdown point, sensitivity curve, and influence function are the three that are most important.
The breakdown point
The breakdown point, which indicates the lowest level of contamination a statistical technique can take before being arbitrarily skewed, is a measure of a statistical procedure’s overall reliability. It offers the worst-case scenario and is attainable by a standard back-of-the-envelope calculation.
This idea has made it easier to look for high breakdown point processes that enable separation of the structure comprising the bulk (or majority) of data from that which may constitute an important minority group. As a result, these are helpful exploratory tools that enable data pattern discovery. Its advancement has revived outdated ideas like the depth of a data cloud and opened up new research trajectories in numerous fields, having a significant impact on computational statistics and data analysis.
Sensitivity Curve
The sensitivity curve measures the effect of a single outlier on the estimator. The idea is to compute the difference between the estimate for a given sample and the estimate when an observation x is added to the sample. The resulting difference is normalized by the fraction of contamination 1/ (N + 1). Hence, for a given estimator the sensitivity curve is defined as:

Influence Function (IF)
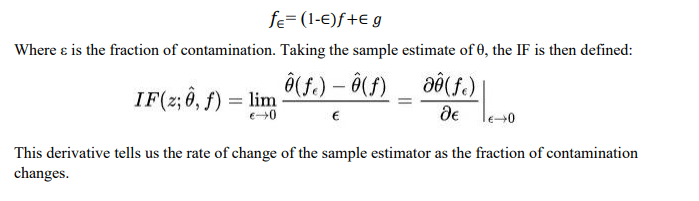
The Influence Function (IF) measures the impact of an infinitesimal fraction of outliers on an estimator. Let’s define a metric of a probability distribution as θ(X) where X is any probability distribution function. This metric can be anything; for example, a measure of the spread of the distribution (e.g. standard deviation).Now, suppose we have a ‘normal’ distribution with thin tails, f. We contaminate this with an outlier distribution g, which is generally assumed to be a point mass at z. This gives a resultant distribution:
Robust Estimator
a method of estimating that is unaffected by slight deviations from the idealized premises that were utilized to develop the algorithm. When there is a lot of noise and outliers in the observed data, robust estimators are preferable, however minimal zone fitting is a proper fitting error metric to get a small tolerance range.
Robust Estimators of the Central Tendency
The central tendency in statistics refers to the tendency for quantitative data to group together around a single central value. The mean is the traditional indicator of central tendency, although it is not reliable. The median and the trimmed mean are the most useful robust estimators of the central tendency.
Robust Estimators of the Dispersion
The variability of the observations in a dataset is represented by the statistical dispersion. The standard deviation is the traditional measure of statistical dispersion, however it is not reliable because a single outlier can make it arbitrary huge. The median absolute deviation and the interquartile range are the two most frequently used reliable estimators of the dispersion.
The Importance of Using Robust Analysis to Understand Change
Leaders gain more insight into aspects of the organization that they may not always be able to perceive by using data to unearth knowledge.
Understanding new customer expectations and gathering solid data to track the development of each person’s change strategy are essential, but all too frequently the discrepancy between actual expectation and company perception of needs results in business process changes that fall short of the desired outcomes.
Deep and solid analysis can find the signals in the noise, and here’s how.
- Collect Data: Delivering a product or service that is pertinent to and appeals to your customer is one aspect of managing business growth that is essential. Data should offer insights in this situation that management and workers on the ground are unaware of. This wealth of knowledge ought to contain realities that the company doesn’t notice in regular operations but that will help future growth and strategy. There are always fresh insights to discover, and when data is gathered, the process should be open-ended so that truths are revealed and outcomes are not affected. For instance, 70% of customers feel connected processes—like seamless handoffs or contextualized engagement based on prior interactions—are highly critical to winning their business, according to the 2020 global Salesforce report.84% of customers say being treated like a person, not a number, is very important to winning their business, with technology driving higher expectations for innovation. The driving force for data collection should be to close the gap between customer expectations and customer experience. Customers judge and trust brands based on their experience as a whole, not just interactions with specific departments, and they demand consistency across touchpoints. Having robust data collection processes allows the organization to see new emerging and changing customer patterns, and potential areas to explore. The diverse analysis of the data collection can spark internal questions about operations. As the data comes in and you understand what you need to fix, how are you analyzing what changes to make? Knowing what the customer wants is a necessity of business. Converting that into the expected experience is the next big challenge.
- Convert data into information: Every organization evolves its own best practices to systematically and continuously analyze the processes unique to their organization, and how they meet and exceed customer needs. Rich data can become deep information that drives innovation areas such as product management, process improvements, and business culture. It’s all interconnected; when organizations are able to make the right links with that information, leaders feel more empowered to make decisions, because data-led decisions that have broad oversight and are paired with good governance and leadership are extremely powerful. Data collection and conversion may seem daunting. There is a plethora of analysis process tools that can fast-track getting a clear definition of the “as-is” business processes, drawing from proven successful models rather than reinventing the wheel, or running the risk of missing touchpoints. They work just as well in service-driven companies as in product production, helping to standardize core, goal-oriented workflows, and stress test weak points. These tools are vital in complex organizations but are also needed to keep nimble smaller companies on track, as well. When working with clients to break down processes and procedures to optimize current methods and add new customer approaches, the data is usually based on more than one variable. With technology generating increasing expectations for innovation, 84% of customers agree that earning their business requires treating them like people, not just numbers. To reduce the gap between client expectations and experience, data collecting should be the main focus. Consumers need consistency across touchpoints because they rate and trust brands based on their overall experience, not simply interactions with particular departments. Strong data collecting procedures enable the firm to identify possible research areas and new, evolving client habits. Internal inquiries concerning operations may be raised by the varied data analysis.
Success can undoubtedly be significantly impacted if correlation is defined as a relationship or pattern between the values of two variables and causation as the happening of one event as a result of another occurrence. When the two are mixed together too frequently, bad assumptions are utilized to make business judgments. Some of my go-to tools to get to the root of how structures meet customer needs are:
- Documenting best practice.
- Model DMAIC (define, measure, analyze, improve, control).
- Maps of value streams (value-enabling, value-adding, and non-value adding activities).
- Analysis of regression (statistical process for estimating and understanding the relationship between variables).
- Gemba walks (visit the location and employees where the task takes place).
- Stage the information: One of the most important talents for every firm is data visualization. Data visualization is: The process of developing graphical representations of information, assisting in the communication of data in a way that is simple for the viewer to analyze and make conclusions. It is used by globally recognized companies like Amazon and Nike. Whatever the leadership’s distance from the processes and the people, this kind of intelligence keeps them informed. People at all levels of the business may work successfully and communicate in the same language by presenting facts in a manner that is easier for the human mind to perceive and comprehend. Errors can be significantly reduced when team members can understand and communicate clearly about strategies and challenges that are important to the organization. As a result, we can add another layer of analysis by better spotting trends and patterns in massive datasets. Providing this kind of upstream and downstream assistance and empowerment within the firm only improves the result and aids in creating a strong and trusted culture. 90% of the information sent to the brain, according to MIT neuroscientists, is visual. If the information is not presented in a way that is simple for people to grasp, it will be difficult to identify the linkages, trends, and patterns that spur creativity and effective change, regardless of how well your data gathering and analysis are done. You may immediately engage your colleagues by staging the information using effective visual aids, which also enables you to effectively translate data insights into organizational action and financial benefit. To reduce the gap between consumer expectations and customer experience, cross-discipline and cross-department deep-dive data analysis approaches are crucial. Leveraging your data to unearth knowledge makes leaders more perceptive. Everyone will have a customer-oriented attitude to process and performance if your personnel have been properly trained on how to filter out the noise and look for the real information that data reveals. Robust analytical techniques and resilience in process and change management make the difference between firms that succeed and fail in our contemporary context of rapid market change.
Robust Statistical Methods in Quantitative Finance
Data on fundamental factor exposure and financial asset returns frequently include outliers, or observations that are incongruous with the majority of the data. Outliers in financial data are common, and academic finance researchers and quantitative finance experts are both aware of this fact and work to reduce their impact on data studies. Frequently used outlier mitigation strategies make the assumption that handling outliers in each variable independently is sufficient. These methods are prone to missing multivariate outliers, which are observations that deviate from the norm in more than one dimension without deviating from the norm in any one variable. In the presence of multivariate outliers, robust statistical approaches provide a preferable strategy for developing trustworthy financial models, but academic researchers and practitioners regrettably underuse them. With two applications to outlier detection and asset pricing research, this dissertation encourages broader use of robust statistical approaches in quantitative finance research.
Machine learning algorithms for Robust statistics
Machine learning techniques depend on the capacity to harmonize ideal mathematical models with noisy, outlier-contaminated real-world data. A series of estimating approaches known as robust statistics find patterns in this imprecise data while lessening the impact of outliers and smaller subgroups. Data analysis may yield answers and conclusions that are skewed if solid statistical techniques are not used. Many applications of computer vision rely heavily on robust statistics. In computer vision, outlier-contaminated data is a common occurrence. Imaging sensors, depth sensors, laser scanners, and other data gathering devices/sensors are fundamentally flawed and are unable to completely avoid taking some erroneous values. Moreover, it is usually not possible to extract the amounts of interest straight from the sensors, which necessitates some sort of pre-processing. Oftentimes, this pre-processing stage introduces mistakes or outliers. The processing of the input data must be carried out robustly in order for computer vision algorithms to function consistently and accurately in real-world contexts.
Conclusion
By offering numerous ideas, concepts, and tools that are now commonplace in statistics, robust statistics made a significant contribution to the growth of contemporary statistics. Without a doubt, robustness will continue to improve in line with how statistics and data analysis are currently progressing and face the same wide range of difficulties. The creation of reliable methods for multidimensional, difficult issues by machine learning algorithms is a special case.
Reference
Zhu, B., Jiao, J., & Steinhardt, J. (2022). Generalized resilience and robust statistics. The Annals of Statistics, 50(4), 2256-2283.
Hampel F.R. (1974). The influence curve and its role in robust estimation. Journal of the American Statistical Association 69, 383–393. [Introduces the influence curve, an important tool in robust statistics.]
Hampel F.R., Ronchetti E.M., Rousseeuw P.J., and Stahel W.A. (1986). Robust Statistics: The Approach Based on Influence Functions, 502 pp. New York: Wiley. [Gives a survey of robust statistical techniques.]
Huber P.J. (1964). Robust estimation of a location parameter. The Annals of Mathematical Statistics 35, 73–101. [Introduces M-estimators. Started much work on robustness.] Huber P.J. (1981). Robust Statistics, 308 pp. New York: Wiley. [Presents a summary of mathematical concepts of robust statistics.]
Tukey J.W. (1960). A survey of sampling from contaminated distributions. Contributions to Probability and Statistics: Essays in Honor of Harald Hotelling (ed. I. Olkin, S.G. Ghurye, W. Hoeffding, W.G. Madow, and H.B. Mann), pp. 448–485. Stanford: Stanford University Press. [Showed how inefficient classical estimators can be in the presence of outliers, and asked for a systematic study of robustness.]
Atkinson, A. C., Riani, M., & Riani, M. (2000). Robust diagnostic regression analysis (Vol. 2). New York: Springer.
Atkinson, A. C., Riani, M., & Cerioli, A. (2004). Exploring multivariate data with the forward search (Vol. 1). New York: Springer.
Liu, R. Y. (1990). On a notion of data depth based on random simplices. The Annals of Statistics, 405-414.
Hampel, F. R. (1968). Contributions to the theory of robust estimation. University of California, Berkeley.
Lecué, G., & Lerasle, M. (2020). Robust machine learning by median-of-means: theory and practice.
Rousseeuw, P. J., & Hubert, M. (1999). Regression depth. Journal of the American Statistical Association, 94(446), 388-402.
Prasad, A., Suggala, A. S., Balakrishnan, S., & Ravikumar, P. (2020). Robust estimation via robust gradient estimation. Journal of the Royal Statistical Society Series B: Statistical Methodology, 82(3), 601-627.
Rousseeuw, P. J., & Leroy, A. M. (2005). Robust regression and outlier detection. John wiley & sons.
Tukey, J. W. (1975). Mathematics and the picturing of data. In Proceedings of the International Congress of Mathematicians, Vancouver, 1975 (Vol. 2, pp. 523-531).
Retrieved from https://statisticsbyjim.com/basics/robust-statistics/
Retrieved from https://projecteuclid.org/journals/annals-of-statistics/volume-50/issue- Retrieved from https://www.forbes.com/sites/ellevate/2021/06/08/the-importance-of-using-robust-analysis-to-understand-change/?sh=1c2d6b943dab
Retrieved from https://www.adelaide.edu.au/aiml/our-research/machine-learning/robust-statistics.
Retrieved from https://www.sciencedirect.com/topics/engineering/robust-estimator#:~:text=Robust%20estimators%20are%20preferred%20when,obtain%20a%20narrow%20tolerance%20band.
Retrieved from https://mathworld.wolfram.com/RobustEstimation.html#:~:text=An%20estimation%20technique%20which%20is,used%20to%20optimize%20the%20algorithm.
Retrieved from https://www.baeldung.com/cs/robust-estimators-in-robust-statistics
Retrieved from https://researchhubs.com/post/ai/data-analysis-and-statistical-inference/robust-statistics.html#:~:text=The%20robust%20statistics%20is%20defined,stays%20the%20same%20at%203.5.
Retrieved from https://rohan-tangri.medium.com/robust-statistics-the-influence-function-d71ac687d046
Retrieved from https://digital.lib.washington.edu/researchworks/handle/1773/40304
4/Generalized-resilience-and-robust-statistics/10.1214/22-AOS2186.short
Written by Mahamudul Hasan Millat
Research Scholar
Statistics Discipline
Science, Engineering & Technology School
Khulna University, Khulna-9208, Bangladesh
Chairman
Career guideline committee
Rotaract District 3281, Bangladesh
Email: millatku1998@gmail.com
Contact us:
If you have any questions, thoughts, or suggestions, please contact us or join our social media networks.
Email us: agribusinessedu@gmail.com, info@agribusinessedu.com
Feel free to comment:
Your email address will not be shared with anyone.
Join our LinkedIn group
https://www.linkedin.com/groups/13943442/
Join our Facebook group
https://www.facebook.com/groups/agribusinesseducationandresearchinternational
You may read:
Agribusiness operational decision-making tools – Agribusiness Education and Research International
The Dollar Crisis and Agro Enterprise Management – Agribusiness Education and Research International
https://agribusinessedu.com/why-is-market-information-important/
Agribusiness value chain in Southeast Asia – Agribusiness Education and Research International
You May Read: What are the Characteristics and Traits of an Entrepreneur? – Agribusiness Education and Research International
You may read: Agribusiness how it works? – Agribusiness Education and Research International
You may read: Covid -19 Pandemic Impact on Agribusiness – Agribusiness Education and Research International
You may read: What is Agribusiness? – Agribusiness Education and Research International
You may read: Agribusiness in Bangladesh – A Basic Introduction – Agribusiness Education and Research International
You may read: Organic Agriculture Introduction – Agribusiness Education and Research International
You may read: What is Sustainable Agriculture? – Agribusiness Education and Research International
What is Permaculture? – Agribusiness Education and Research International
E-Commerce and Supply Chain Finance – Agribusiness Education and Research International
What is Supply Chain Finance? – Agribusiness Education and Research International
What is an agile supply chain in Agribusiness? – Agribusiness Education and Research International
What is Supply Chain Management in Agribusiness? – Agribusiness Education and Research International
Supply chain management and Agribusiness – Agribusiness Education and Research International
Factors Affecting Supply Elasticity – Agribusiness Education and Research International